

In short
- Beam profiling shows where the energy is. It measures the spatial intensity of a laser beam: width, position, shape and divergence, and it is the basis of beam-quality (M²) measurement.
- Use one width definition and say which. D4σ (ISO 11146 second moment), 1/e², FWHM and knife-edge widths give different numbers for the same beam unless the beam is a clean Gaussian.
- Choose the profiler by wavelength first. UV–VIS–NIR for 300–1100 nm, SWIR up to 2.05 µm, MWIR for 1.5–5.7 µm and LWIR for 7.7–12 µm.
- Set up the measurement before you trust it. At least 10 pixels across the beam (about 20 for best accuracy), the beam under about one third of the sensor width, no saturation and a clean background.
- Profiling pays off on the production line. Pass/fail limits, reports and trends turn a lab measurement into quality control for every unit.
What laser beam profiling is, and why it matters
A laser is specified by its power and wavelength, but what the laser does depends on how that power is distributed in space. Two lasers with the same power can cut, weld, treat tissue or couple into a fiber very differently if one beam is larger, elliptical, off-centre or has a hot spot. Laser beam profiling measures that spatial distribution of intensity, so you can see the beam instead of inferring it from the result.
A beam profiler has two parts: a detector that records the intensity across the beam, and software that turns the image into numbers: width, centroid, ellipticity, uniformity and, from several planes, divergence. Engineers use it in three places:
- R&D: to characterise a new laser or optical design, compare it with the model and find aberrations early.
- Production: to verify each laser, module or optical assembly against limits before it ships.
- Service and integration: to align the beam in a system and check that it has not drifted or degraded.
See a laser beam profiler at work
The short demonstration shows a live measurement in the IZAK beam profiler application: the beam image in grey scale or false colour, a region of interest set around the spot, and the readouts the rest of this guide explains (centroid position, beam width and the orientation angle of an elliptical beam), updated in real time and plotted over time. The camera controls are set in the same window, which is the first step of every reliable measurement (see Setting up a measurement you can trust).
The parameters a beam profiler reports
The size of the beam along two axes. It decides spot size, irradiance and how the beam focuses. Always state which definition was used.
Where the beam sits on the sensor. The centroid is the intensity-weighted centre; the peak is the brightest pixel. They differ for asymmetric beams.
The ratio of the minor to major width and the angle of the axes. Diode lasers and misaligned optics often give elliptical beams.
How fast the beam grows with distance. It is measured from the width at several planes or in the focal plane of a lens.
How close the beam is to an ideal Gaussian. M² = 1 is a perfect Gaussian beam. It is calculated from widths measured at several planes, not from one image.
How much the centroid moves over time or from pulse to pulse. It matters for fiber coupling, long beam paths and alignment.
For top-hat and homogenised beams: how flat the plateau is and how steep the edges are, instead of a single width.
How well the profile matches a Gaussian or top-hat model. A poor fit points to higher-order modes, clipping or aberrations.
Beam width: one beam, several numbers
There is more than one way to define the width of a beam, and the definitions agree only for a clean Gaussian (TEM₀₀) beam. For multimode, diode, clipped or top-hat beams the numbers can differ by tens of percent. When you compare results, specify the definition, the measurement plane and how the background was handled.
| Definition | How it is calculated | Gaussian beam, in terms of w | When to use it |
|---|---|---|---|
| D4σ (second moment) | Four times the standard deviation of the intensity distribution along each axis | 2w | The ISO 11146 definition. Required for M² and for comparing non-Gaussian beams. Sensitive to noise and background in the wings. |
| 1/e² diameter | Width between the points where intensity falls to 13.5% of the peak | 2w | Common for near-Gaussian beams and in laser datasheets. Ambiguous for beams with side lobes. |
| FWHM | Width between the points at 50% of the peak | 1.177 w | Robust to noise. Useful for pulses and narrow features; underestimates the energy-carrying size. |
| Knife-edge 10/90 | Distance over which a moving edge transmits 10% to 90% of the power | 1.282 w | Scanning measurements of very small or very high-power beams. |
| 86.5% power content | Diameter of the circle that contains 86.5% of the total power | 2w | Energy-based size for processing and safety calculations. |
w is the 1/e² radius of a Gaussian beam. For a real beam, the D4σ width is the reference: it is defined for any profile and it is what the ISO 11146 beam-quality method uses.
Convert between beam width definitions
Enter one width of a Gaussian beam. The tool gives the other definitions and, if you add the pixel size, how many pixels cover the beam. The conversion is exact for TEM₀₀ beams only.
Camera-based profilers and scanning profilers
Two families of instruments measure beam profiles. Both are valid; the beam and the job decide which one fits.
| Camera-based profiler | Scanning slit or knife-edge profiler | |
|---|---|---|
| What it records | The full two-dimensional image of the beam in every frame | One-dimensional profiles along two or more axes, built up by a moving aperture |
| Beam shapes | Any shape: Gaussian, elliptical, multimode, top-hat, multi-spot patterns | Best for near-Gaussian beams; complex shapes are hard to interpret |
| Pulsed lasers | Single-shot capture with a global-shutter sensor and a trigger | Limited: needs a high repetition rate so the scan samples many pulses |
| Smallest beam | Set by the pixel size: about 10 to 20 pixels across the beam | Very small focused spots, down to a few microns |
| Power | Needs attenuation; sensors saturate at low irradiance | Tolerates higher power density at the aperture |
| Typical use | R&D, alignment, production test, pulsed and shaped beams | Focused CW spots, very high power density |
IZAK laser beam profilers are camera-based. They capture the whole beam in each frame, which is what you need for pulsed lasers, shaped beams and production tests with pass/fail limits.
Choosing the profiler by wavelength
The detector must respond at the laser wavelength, and no single sensor covers the ultraviolet to the long-wave infrared. Start from the wavelength, then check beam size, power and pulse format.
| Family | Wavelength range | Typical lasers | Notes |
|---|---|---|---|
| UV–VIS–NIR | 300–1100 nm | Nd:YAG 1064 nm and harmonics, diode lasers 405–980 nm, HeNe, fiber-coupled visible lasers | The widest choice of resolution and sensor size; global-shutter models for pulsed lasers. |
| SWIR | Up to 2.05 µm | Telecom and fiber lasers at 1310 and 1550 nm, eye-safe lasers | For short-wave infrared lasers beyond the reach of visible-range sensors. |
| MWIR | 1.5–5.7 µm | Thulium around 2 µm, holmium around 2.1 µm, Er:YAG at 2.94 µm, mid-IR sources | Cooling, noise and dynamic range drive the choice of configuration. |
| LWIR | 7.7–12 µm | CO₂ lasers at 9.3 and 10.6 µm | Attenuation is designed for the beam power and size at the sensor. |
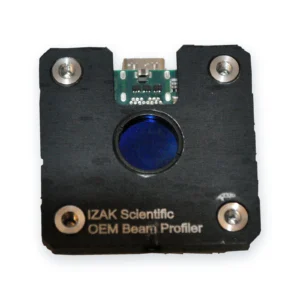
For integration into your own instrument, the OEM board-level beam profilers use the same software in a compact module. To see how pixel size affects the smallest beam you can measure, read Small or large pixels?
Setting up a measurement you can trust
Most wrong beam widths come from the set-up, not from the profiler. Check these points before you record a result:
- Size the beam to the sensorAt least 10 pixels across the 1/e² diameter, about 20 for errors below a few percent, and the beam under about one third of the sensor width so the wings are not clipped.
- Attenuate before the sensorCamera sensors need only microwatts to milliwatts. Use a beam sampler, wedges or neutral-density filters rated for the power, and keep them away from the focus to avoid thermal lensing and ghost reflections.
- Avoid saturationKeep the peak below full scale, typically 50–90%. A single saturated pixel flattens the peak and makes every width wrong.
- Subtract the backgroundRecord a dark frame with the beam blocked, or use the software baseline correction. Background in the wings inflates second-moment widths more than any other error.
- Use a proper integration areaFor D4σ, ISO 11146 integrates over an area about three times the beam width, found iteratively, so noise far from the beam is excluded.
- Match the capture to the laserFor pulsed lasers use a global-shutter sensor triggered by the laser, check the pulse energy against the damage threshold, and average several frames for CW beams.
Free engineering tool
Gaussian Beam CalculatorRayleigh range, divergence and beam size at any distance, with a live view of the spot on the sensor.Beam quality and M²
M², the beam propagation ratio, compares a real beam with an ideal Gaussian beam of the same wavelength. It is the product of the waist radius and the far-field divergence half-angle, divided by λ/π. A perfect TEM₀₀ beam has M² = 1; a beam with M² = 2 focuses to a spot twice as large at the same divergence.
M² cannot be found from a single image. ISO 11146 measures the D4σ width at several planes through a focus: at least ten positions, about half within one Rayleigh range of the waist and about half beyond two Rayleigh ranges, then fits a hyperbola to find the waist, the divergence and M². A profiler gives the width at one plane, so either the sensor or the laser is moved along the beam axis, by hand or on a motorised stage, and the widths are recorded at each position. Step-by-step instructions and a worked example are in our M² measurement guide.
Profiling pulsed lasers
A pulsed laser delivers its energy in short bursts, so the sensor must capture the pulse, not the gaps between pulses. Three rules cover most cases:
- Global shutter: all pixels expose at the same moment. Rolling-shutter sensors can cut a pulse across the frame and suit CW lasers only.
- Trigger: synchronise the exposure with the laser trigger or a photodiode, so each frame contains exactly one pulse or a known number of pulses.
- Peak power and damage: plan the attenuation from the pulse energy and duration, not the average power. Short pulses can damage a sensor that the average power would not.
Pulse energy, duration and shape are measured with other instruments. When you need profile, energy and pulse shape in one run, see TriBeam Precision.
Beyond Gaussian: top-hat, multimode and diode beams
Many applications use beams that are not Gaussian on purpose. Homogenised top-hat beams give uniform exposure for annealing, lithography and medical treatments. Multimode fiber lasers carry more power at the cost of beam quality. Diode laser bars produce wide, asymmetric beams with different divergence on each axis.
For these beams a single width is not enough. Look at the plateau uniformity, the edge steepness and the full image. A camera-based profiler shows the whole pattern, and the software can report uniformity over a region instead of a Gaussian fit. Our article on square top-hat beams shaped with DOEs shows how this is verified in practice.
From the lab to the production line
In production, the question changes from “what does this beam look like?” to “does this unit pass?”. A production profiler needs a robust mount, fast frames and software that applies the same test to every unit:
- Pass/fail limits on width, ellipticity, centroid and pointing, set once by engineering.
- A report per unit with the image, the values and the limits, saved with the serial number.
- An automation interface so the test station runs without an operator.
- Trends across stations and batches, to catch drift before it becomes scrap. See AI analytics for beam profiling data.
Beam profiling knowledge library
Each article below goes deeper into one part of this guide.
What a profiler measures and how it supports laser quality assurance.
Medical, material processing, defence and research applications.
Free PDF · 6 pages
Take the checklist with you
- Wavelength-to-detector map, 0.3 to 12 µm
- Pixel-pitch and sensor-size rules with worked examples
- Pulsed vs CW, attenuation and production QA checklists
- A fill-in specification worksheet for your RFQ
What to send us for a recommendation
With these details an engineer can recommend the detector, attenuation and integration level in one reply:
- Laser type and wavelengthe.g. Nd:YAG, 1064 nm
- CW or pulsedpulse width, energy and repetition rate
- Power or energyat the measurement plane
- Beam size and divergencewhere you will measure
- EnvironmentR&D bench, OEM integration or production line
- Software needsreports, pass/fail, automation interface
Frequently asked questions
QWhat is laser beam profiling?
QWhich beam width definition should I use?
QHow is FWHM related to the 1/e² diameter?
QHow many pixels should cover the beam?
QCan a camera-based profiler measure pulsed lasers?
QWhich profiler do I need for a CO₂ laser?
Tzachi Sabati
CEO, IZAK Scientific
Physicist specializing in photonics and quantum technologies, with deep expertise in quantum sensors and advanced optical systems. Leads the Advanced Quantum Lab course at the Technion, bridging academic excellence with industry innovation. At IZAK Scientific, provides cutting-edge photonics-based solutions, developing customized inspection and sensing systems for R&D and production. Passionate about advancing quantum sensing applications and integrating novel technologies to meet industry needs.
