From beam image to production and R&D insight
Laser beam profiling does not end with a single image or a single pass/fail report.
Each test can contain a rich set of measurements such as beam width major and minor, area, ellipticity, center of mass, azimuth angle, peak position, acceptance limits, and test metadata such as date, station, batch, and serial number.
The real engineering value appears when all of this information is connected.
At IZAK Scientific, we are now offering AI Analytics for the IZAK Laser Beam Profiler — a new capability and service designed to turn beam-profiler measurements into actionable engineering insight for both production environments and R&D workflows.
Why static beam-profiler reports are not enough
A traditional measurement report is useful when looking at one laser or one run at a time. But in real engineering work, teams often need to analyze:
- many reports over time
- more than one measurement simultaneously
- behavior across stations, batches, or product families
- trends before failure occurs
- recurring relationships between process changes and beam performance
That is where static reports become limiting. They show the result of one test, but they do not easily reveal the broader pattern.
For example, a beam can still pass today, while the margin to the specification limit is already shrinking. In practical terms, if the upper beam-width limit is W
A pass/fail decision only tells us whether M is positive or negative at that moment.
Analytics shows how M evolves over time, whether it changes by batch or station, and whether the process is drifting toward failure.
From single-parameter review to multi-measurement analytics
One of the important points in this development is that the system is not limited to one measurement. It is built to analyze multiple measurements together and derive statistics, trends, correlations, and engineering conclusions from the full dataset.
A single test report can be viewed as a measurement vector:
where each report i contains multiple beam-related parameters.
Once the data is structured this way, the system can evaluate for each parameter:
- mean and spread
- drift over time
- specification margin
- pass/fail contribution
- comparison by station, batch, product type, or date range
- relationships between measurements rather than isolated values
This is important because real beam behavior is rarely explained by one number alone.
A process issue may appear first as a subtle change in beam width, then later affect ellipticity, center of mass, or yield. Looking at measurements together makes it much easier to identify early patterns.
What the AI Analytics workflow includes
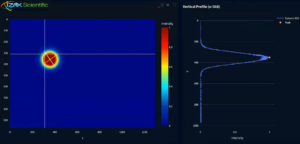
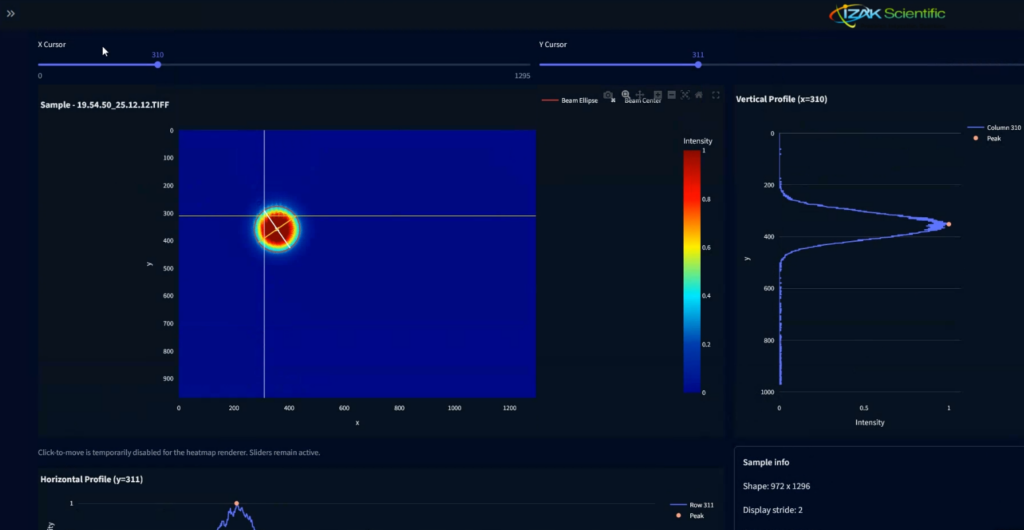
Beam image viewer with overlays and profiles
The workflow starts with the actual measured beam image.
The beam viewer allows engineers to inspect the beam profile with overlays, cursors, and intensity profiles, so the image itself remains part of the analysis. This is important in photonics and laser engineering, where the visual appearance of the beam and the numerical measurements must remain connected.
Data exploration, filtering, and graph-based analytics
Historical reports can be organized into a searchable analytics layer, allowing users to filter by date, station, laser type, batch, serial number, and other fields relevant to the application.
This makes it possible to:
- monitor statistics across many runs
- compare behavior across VIS, MWIR, and LWIR systems
- observe trends in beam width and other measurements
- identify recurring contributors to failure
- investigate changes before they become yield problems
Instead of reviewing reports one by one, engineers can move immediately to charts, trends, and grouped statistics.
Measurement analysis across many parameters
The system is designed to analyze more than one measurement and extract conclusions from the full set of test results.
That means users can study not only beam width, but also combinations of:
- beam width major and minor
- ellipticity
- area
- center of mass
- peak position
- azimuth angle
- pass/fail outcomes
- custom test metrics
This is useful both for production tracking and for engineering investigations.
For example, a team may want to understand whether a change in beam width is isolated, or whether it appears together with center-of-mass drift or changes in ellipticity.
Report detail and engineering traceability
High-level analytics are valuable only when they remain traceable back to the original report.
That is why the workflow also includes a detailed report view, where the user can open the exact report, review measured values, compare them against criteria, and see which parameter failed and in which direction.
This keeps the system practical for real engineering use. The analysis does not stop at a chart or AI summary. It goes back to the actual report and the actual test evidence.
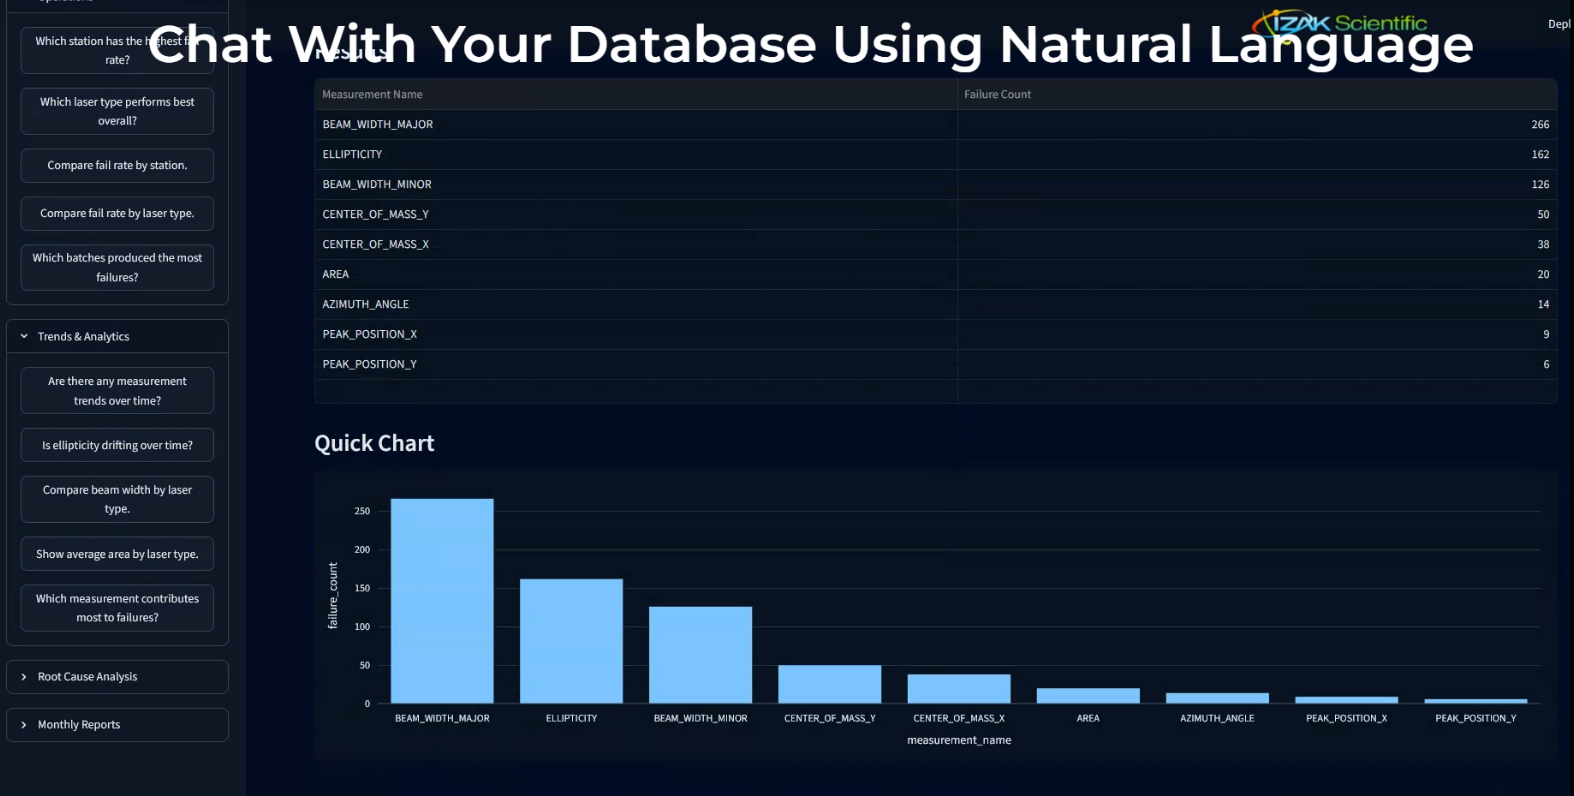
IZAK Insight Chat
To make data access faster and more intuitive, the system also includes IZAK Insight Chat — a natural-language interface for the measurement database.
Instead of manually searching through filters or writing queries, users can ask any question such as:
- Which measurement contributes most to failures?
- Which station should be investigated first?
- Show the latest failed report with major beam width above the limit.
- Compare beam-width behavior before and after a batch change.
- Summarize weekly trends across multiple measurements.
The purpose is not to replace engineering judgment.
The purpose is to help engineers reach the relevant evidence faster.
Scheduled custom reports delivered by email
Another important capability is custom scheduled reporting.
Many users do not want to log in every day just to check whether a trend has changed. They want the right information delivered automatically.
The platform can generate custom reports on a daily, weekly, or monthly basis, and send them directly by email. These reports can be configured to include the specific measurements, filters, graphs, and summary tables relevant to the customer or team.
This makes the system useful not only as an interactive analytics tool, but also as a practical operational reporting solution.
Setup is straightforward, so customers can define the reporting cadence and content that matches their process.
Built for both production lines and R&D work
This capability is relevant in more than one environment.
For production lines
In manufacturing, the main goal is often to monitor stability, yield, and process drift across many units.
Teams need to compare stations, batches, shifts, or components and quickly identify where the process is changing.
A beam-width trend, for example, may remain unnoticed if reports are reviewed one by one. In a structured analytics environment, the drift becomes visible immediately, especially when connected to station data, component lots, or time windows.
For R&D and characterization work
In R&D, the challenge is often different. The issue is not always yield, but understanding performance across repeated experiments, prototype iterations, alignment changes, different optics, or different operating conditions.
When many measurements have been carried out, engineers need a way to organize and analyze performance across the full set of runs. AI Analytics helps by turning those runs into a searchable, comparable engineering dataset instead of a collection of disconnected files.
Example: tracing a beam-width trend to a new lens batch
A good example of the value of this approach is a laser manufacturing line where the major beam width was observed to increase over time.
At first, this kind of drift can look like a general process variation. But when the data is analyzed across time, station, and batch information, the system can reveal a more specific relationship.
In this case, the increasing trend in major beam width was linked to a new batch of laser lenses.
This is exactly the type of insight that is difficult to extract from isolated reports, but much easier to identify when multiple measurements and production metadata are analyzed together. Instead of seeing only that some units failed, the team can understand why the process changed and where to investigate first.
More than a demo: this is now a service offering
This is not only a demonstration video. It is a service we now offer for customers who want to extend their beam-profiling workflow with AI-driven analytics.
Depending on the application, the service can include:
- structuring historical measurement reports into a database
- multi-measurement analytics and trend dashboards
- report drill-down and traceability workflows
- beam image viewer integration
- IZAK Insight Chat for natural-language data inquiry
- scheduled daily, weekly, or monthly email reports
- adaptation for production monitoring or R&D performance analysis
- customization for specific laser families, test stations, and measurement criteria
A practical foundation for future AI capabilities
A well-structured measurement database also creates the right foundation for future functions such as:
- anomaly detection
- early drift warnings
- near-limit alerts
- root-cause guidance
- predictive quality scoring
- automated engineering summaries
The important first step is to build analytics that engineers can trust: connected to the beam image, connected to the report, and connected to the actual measurement data.
Let’s discuss your application
If your team is working on laser manufacturing, beam characterization, optical testing, or photonics R&D, and you would like to add AI Analytics to your beam-profiling workflow, we would be glad to discuss your application.
Book or set up a demo meeting with IZAK Scientific, or contact us through our website to explore how AI Analytics can support your production line or R&D workflow.
Contact us today.
Tzachi Sabati
CEO, IZAK Scientific
Physicist specializing in photonics and quantum technologies, with deep expertise in quantum sensors and advanced optical systems. Leads the Advanced Quantum Lab course at the Technion, bridging academic excellence with industry innovation. At IZAK Scientific, provides cutting-edge photonics-based solutions, developing customized inspection and sensing systems for R&D and production. Passionate about advancing quantum sensing applications and integrating novel technologies to meet industry needs.
