

In short
- Optical analysis measures how light is emitted, transmitted, reflected, absorbed or scattered, and turns that into a property you can specify: concentration, transmittance, refractive index, surface form, image quality, spectrum or beam quality.
- Start from the question, not the instrument. The same spectrophotometer answers “what is in this sample” and “does this window meet its transmission spec”, but the set-up and the uncertainty budget are different.
- Separate surface from bulk. A plain glass window loses about 8% to reflection before it absorbs anything. The calculator below separates the two.
- Plan the error budget. Stray light, detector linearity, bandwidth, angle of incidence, polarization and temperature decide whether a result can go into a specification.
What is optical analysis?
Optical analysis is the measurement of light after it has interacted with something, and the use of that measurement to learn about the “something”. Light can be emitted by a source, transmitted through a sample, reflected from a surface, absorbed, scattered, refracted or changed in polarization. Each of these interactions depends on the physics of the object, so a careful measurement of the light gives a number that describes the object.
In practice the term covers three families of work:
- Optical analysis of materials and samples – composition and concentration from absorption spectra, spectral transmittance and reflectance, refractive index and dispersion, haze, fluorescence and stress birefringence.
- Optical analysis of components and systems – surface form and wavefront error by interferometry, image quality (MTF), alignment, boresight and stray light of lenses, windows, filters and complete instruments.
- Optical analysis of light sources and lasers – radiometric and photometric output, spectrum and color, pulse shape, laser beam profile, M² and pointing stability.
A fourth meaning appears in engineering teams: optical design analysis, the simulation of a system before it is built (ray tracing, tolerancing, stray-light and thermal analysis). It answers the same questions on paper, and the measurements above confirm the answers on the bench. This guide covers all four and links to deeper articles on each method.
Which method answers which question?
Choose the method from the property you need to report. The table maps the most common questions to the quantity, the method and the typical output.
| Your question | Quantity measured | Typical method | Typical output |
|---|---|---|---|
| What is in the sample, and how much? | Absorbance spectrum | UV–VIS–NIR or IR absorption spectroscopy, Beer–Lambert law | Concentration, identification |
| How much light does this window or filter pass? | Spectral transmittance | Spectrophotometer with a collimated or slightly converging beam | T(λ) in %, optical density |
| How well does the coating reflect or suppress reflection? | Specular or diffuse reflectance | Reflectance accessory or integrating sphere | R(λ) in %, at a stated angle |
| What is the refractive index? | Index and dispersion | Minimum deviation, V-block, prism coupler, ellipsometry | n(λ), Abbe number |
| Why does the part look milky? | Scattered fraction | Integrating sphere (haze), angle-resolved scatter | Haze %, scatter vs angle |
| Is the surface flat enough? | Surface or wavefront error | Laser interferometry | PV and RMS in waves or nm |
| How sharp is the image? | Modulation transfer | Slanted edge or target imaging | MTF vs spatial frequency |
| Is the glass stressed? | Birefringence | Polariscope or polarimeter | Retardance in nm/cm |
| How much light does the source emit? | Radiometric and photometric output | Integrating sphere, spectroradiometer, power meter | W, lm, cd, spectrum, CCT |
| Is the laser beam good enough? | Spatial intensity distribution | Camera-based beam profiler (ISO 11146) | D4σ width, M², divergence, pointing |
Optical analysis of materials: transmission, absorption and reflection
Most material analysis starts with three numbers at each wavelength: the fraction of light transmitted (T), reflected (R) and lost inside the sample to absorption or scattering. For a sample with no scattering, they add up to one. A spectrophotometer measures T, and sometimes R, against a reference beam or a stored 100% baseline.
Absorbance and optical density. Absorbance is A = −log₁₀(T). An absorbance of 1 means 10% transmission, 2 means 1%, 3 means 0.1%. Filter makers call the same quantity optical density (OD); an OD 4 filter passes 0.01%. Using a logarithmic scale lets you add the effect of stacked filters and see small changes in a strong absorber.
The Beer–Lambert law. In a dilute solution or gas, absorbance grows linearly with path length and concentration: A = ε·b·c, where ε is the molar absorptivity, b the path length and c the concentration. This is the basis of most quantitative optical analysis in chemistry, process monitoring and gas sensing. Linearity holds when the light is close to monochromatic compared with the absorption band, the sample does not scatter, and the concentration is low enough that molecules do not interact.
Surface losses come first. For a solid sample, part of the “missing” light was never inside the material. At normal incidence each uncoated surface reflects R = ((n − 1)/(n + 1))². For a common crown glass (n ≈ 1.52) that is about 4.2% per surface, so even a perfectly transparent window transmits only about 91.9% once the reflections between the two surfaces are included. Report internal transmittance (bulk only) when you characterize a material, and external transmittance (what the user gets) when you specify a part.
Separate reflection from absorption
Enter the refractive index, the measured transmittance of an uncoated, polished, parallel sample at normal incidence, and its thickness. The tool removes the two surface reflections, including the multiple reflections between them, and returns the internal transmittance and the absorption coefficient.
Assumes no scattering, no coating and incoherent reflections (sample much thicker than the coherence length). α is the natural-log absorption coefficient: Ti = e−αd.
Reflectance and scatter. Specular reflectance is measured at a stated angle, for example 8° or 45°, often for both polarizations, because coatings behave differently in s and p light. Rough, coated or textured samples scatter light in all directions; an integrating sphere collects the total (specular plus diffuse) reflectance or transmittance, and the difference between the total and the direct beam gives the haze.
Refractive index and dispersion. The most accurate bulk methods measure the angle of minimum deviation through a prism at several spectral lines. Faster methods use a V-block (a known prism with a V-shaped groove for the sample), a prism coupler for thin films and thin glass, or ellipsometry for coatings. The result is n(λ) and the Abbe number, which an optical designer needs to predict chromatic aberration.
Beer–Lambert: absorbance and concentration
Predict the absorbance of a sample before you measure it, or turn a measured absorbance into a concentration. The tool also flags readings outside the range where a typical spectrophotometer is linear.
Use ε at the wavelength you measure. The default (6220 L/(mol·cm)) is the textbook value for NADH at 340 nm, a common check in biochemistry labs.
Optical analysis of components and systems
For lenses, windows, mirrors, filters and complete instruments, the question is not what the part is made of but how it changes the light that passes through it.
Surface form and wavefront. A laser interferometer compares the test surface with a reference and turns the fringe pattern into a height map. Results are given as peak-to-valley (PV) and RMS error, in waves at the test wavelength or in nanometres, often after removing tilt and focus. Flat optics for precision systems are commonly specified at λ/10 PV or better. See our article on interferometer testing for flatness measurement for a worked set-up.
Image quality. The modulation transfer function (MTF) shows how much contrast an imaging system keeps at each spatial frequency. It is measured by imaging a slanted edge, a slit or a target and analysing the result. MTF is the standard acceptance test for camera lenses, thermal imagers and inspection optics, because it combines aberrations, focus and detector sampling in one curve.
Alignment, boresight and stability. Multi-channel electro-optical systems must point every channel at the same place and keep it there through temperature and vibration. A collimator and a camera measure the angle between channels; repeated measurements over time give drift and jitter. Our guide to laser pointing stability shows how to separate the two.
Polarization and stress. Residual stress in glass or in a bonded assembly makes it birefringent. A polariscope shows the stress pattern; a polarimeter gives the retardance in nm per cm of path, which is what a material or assembly specification usually limits.
Fiber and coupling. In fiber systems, optical analysis means insertion loss, end-face quality and coupling efficiency. The fiber coupling efficiency calculator estimates mode-matching loss from beam size and fiber mode field.
Optical analysis of light sources and lasers
Radiometry and photometry. Radiometric quantities (W, W/sr, W/m²) describe the physical power of the light. Photometric quantities (lm, cd, lx) weight that power by the sensitivity of the human eye, so a deep-red LED and a green LED with the same radiant power have very different luminous flux. An integrating sphere collects all the light from a source for total flux; a spectroradiometer gives the spectrum, from which color coordinates, dominant wavelength, CCT and Duv are calculated. Try the CCT and Duv calculator, and read how an integrating sphere measures LED flux, spectrum and pulse shape.
Detectors. The detector sets the spectral range, sensitivity, speed and linearity of every optical measurement. Specific detectivity (D*) and noise-equivalent power (NEP) let you compare detectors of different sizes. Our technical review of optical sensors in radiometry explains how to choose one.
Laser beam analysis. For lasers, the key optical analysis is spatial: beam width, shape, centroid, ellipticity, divergence and beam quality (M²). A camera-based beam profiler records the intensity distribution, and the software computes the second-moment width defined in ISO 11146. Start with our laser beam profiling guide, compare beam width definitions, and follow the M² measurement guide for beam quality.
Temporal analysis. Pulsed sources need the pulse shape, energy and repetition rate as well. A fast photodiode and an oscilloscope give the pulse shape; a calibrated energy sensor gives the energy; the beam profile at the same plane ties the two into fluence.
Optical design analysis: before there is hardware
When the object does not exist yet, optical analysis is done in software. Ray tracing predicts image quality and throughput; tolerance analysis shows which manufacturing and alignment errors matter; stray-light analysis follows unwanted paths through mounts and baffles; thermal analysis predicts focus shift and stress across the operating range. Good design analysis also defines the tests that will prove the hardware: which MTF, which wavefront error, which transmittance, at which wavelength and with what tolerance. Read how we take a system from requirement to production.
Six error sources that decide the result
Light that reaches the detector by the wrong path. It flattens high absorbance readings and fills the dark parts of an image. Baffles, apertures and a dark reference control it.
Every detector saturates at some level and drowns in noise at another. Check that signal and reference are both inside the linear range, or use calibrated attenuation.
A measurement bandwidth wider than the feature you measure smears narrow absorption lines and filter edges. Match the slit or filter width to the feature.
Angle of incidence and beam convergence shift filter edges and change reflectance. State them in the result and keep them the same as in the application.
Tilted surfaces, gratings and coatings treat s and p light differently. Measure both, or depolarize and say so.
Sources drift and samples change with temperature. Warm up, measure the reference often, and use standards with a traceable calibration.
From the lab to the production line
A laboratory instrument answers a question once. A production test answers it for every unit, in seconds, with a pass/fail decision and a stored record. Moving optical analysis to production usually means a dedicated station: a fixed optical path, a fixture that places each part the same way, automatic reference checks, and software that applies limits and writes a report. The physics stays the same; the work is in repeatability, speed, cycle time and data handling. IZAK designs and builds such stations for LED color and position, laser beam quality, fiber inspection and radiometric measurements.
IZAK products for this application
Instruments for optical analysis of light sources and lasers, and custom stations when the measurement has to run on a production line.
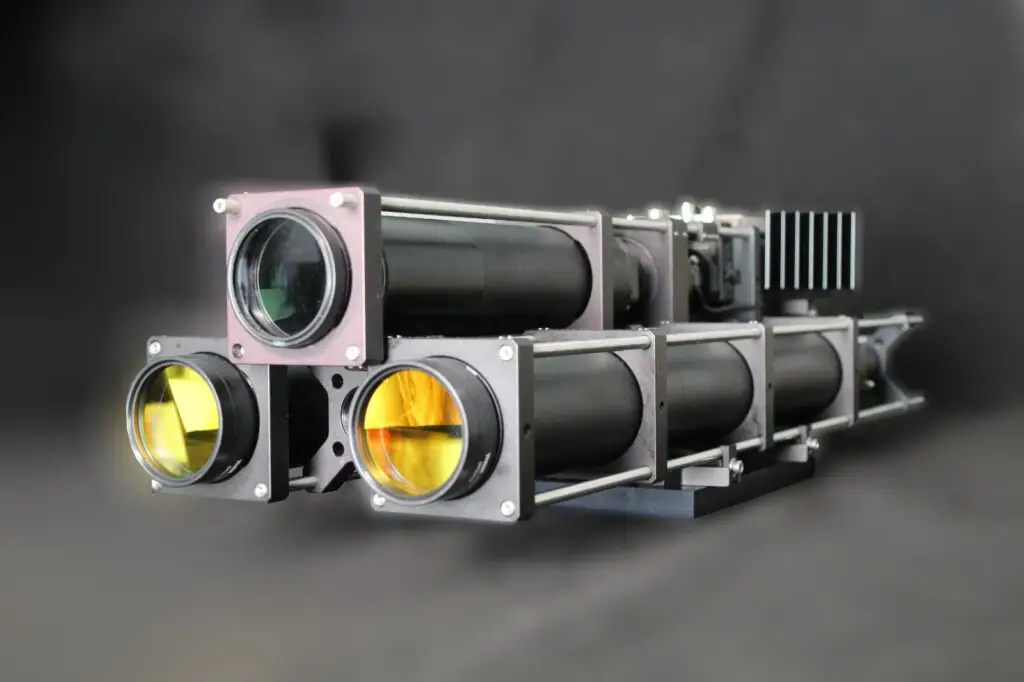 RadiometryMulti-Channel Spectro-RadiometerFast spectral and radiometric measurement with selectable spectral channels and a narrow, uniform field of view.View product →
 Laser beam analysis · UV to LWIRLaser Beam ProfilersISO 11146 beam width, M², divergence and pointing, in UV–VIS–NIR, SWIR, MWIR and LWIR families.View product →
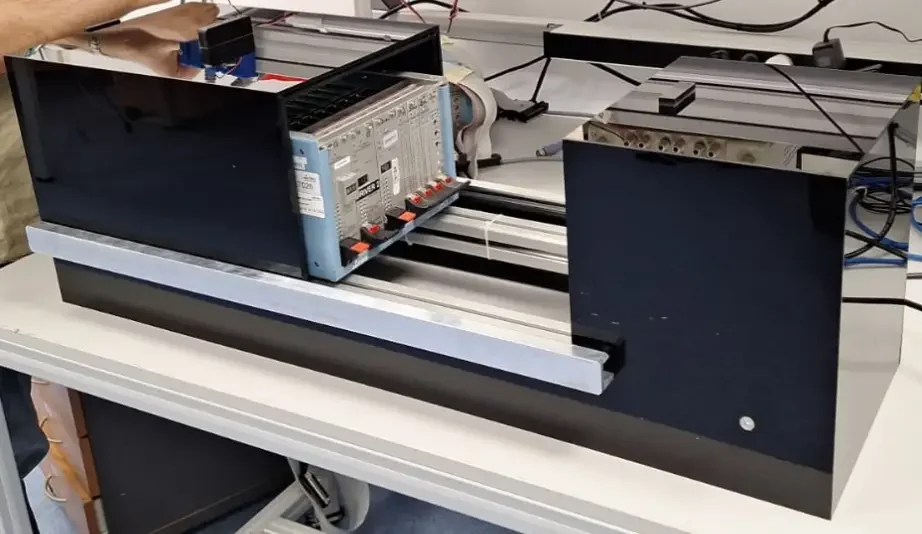 Production testLED Color and Position TesterChecks the color and position of every LED on a board, with pass/fail limits and a report per unit.View product →
Need a measurement that no catalog instrument covers? We design and build electro-optical test systems →
What to send us for an optical analysis set-up
With these details an engineer can propose a method, an instrument or a custom station in one reply:
- What you need to knowthe property and the decision it supports, e.g. transmittance spec, concentration, beam quality
- The objectsample, component, system or source; size, material, coating
- Wavelengthsa single line, a band or a full spectrum
- Required accuracytolerance, repeatability and any standard you must follow
- Throughputa few samples in the lab or every unit on a line, and the cycle time
- Environment and interfacesclean room, temperature, data and automation interfaces
Frequently asked questions
QWhat is optical analysis?
QWhat is the difference between transmittance, absorbance and optical density?
QWhy is my measured transmittance lower than the material datasheet value?
QWhich optical analysis method is used for lasers?
QCan optical analysis run on a production line?
Tzachi Sabati
CEO, IZAK Scientific
Physicist specializing in photonics and quantum technologies, with deep expertise in quantum sensors and advanced optical systems. Leads the Advanced Quantum Lab course at the Technion, bridging academic excellence with industry innovation. At IZAK Scientific, provides cutting-edge photonics-based solutions, developing customized inspection and sensing systems for R&D and production. Passionate about advancing quantum sensing applications and integrating novel technologies to meet industry needs.
