

In short
- Pointing stability is centroid movement over time. A camera profiler finds the beam centroid in every frame; the spread of those positions over a stated time is the stability. ISO 11670 reports it as twice the standard deviation, per axis.
- Angle needs a lens. At the focal plane of a lens, the spot moves by focal length × angle and ignores lateral shifts of the beam. A plain camera in the beam mixes the two.
- A camera resolves a few hundredths of a pixel. With a good signal-to-noise ratio the centroid noise is about 0.02–0.05 pixel (2σ). With a 500 mm lens and 3.45 µm pixels that is well under 1 µrad.
- The set-up is usually the limit. Air currents, warm mounts and vibration move the spot more than the laser does. Measure the set-up floor before you blame the laser.
What pointing stability means
A laser beam does not stay exactly where it was aligned. Its direction and position wander slowly as the laser warms up and the room temperature changes (drift), and they shake quickly with vibration, air turbulence and pump fluctuations (jitter). For a laser that feeds a fiber, a scanner, an interferometer or a target kilometres away, this movement decides whether the system holds its alignment.
A camera-based laser beam profiler measures it directly: in every frame the software computes the beam centroid, the first moment of the power density distribution defined in ISO 11146. Logging the centroid over time gives a cloud of positions, and the statistics of that cloud are the stability.
The standard for this measurement is ISO 11670 (beam positional stability). Its main points, in short:
- Stability is reported as twice the standard deviation of the centroid movement, in x and y separately, around the average position.
- Two quantities are distinguished: positional (lateral) stability at a given plane, and angular stability, measured at the focal plane of a focusing element.
- The time scale is part of the result: short term (within 1 s), medium term (within 1 min) and long term (within 1 h). The change from a cold start is a separate value.
- The laser warms up for at least one hour before the test unless the manufacturer states otherwise, a large number of measurements is used (more than 1000 for the beam axis distribution), and the test bench must be about ten times more stable than the laser.
Three ways to set up the measurement
The centroid at that plane is the lateral position. A change of angle also moves the beam there, by distance × angle, so the result mixes position and pointing. Good for checking the beam where it is used, for example at a fiber launch or a process head.
A lens maps angle to position: the spot moves by f × θ, and a parallel shift of the beam does not move it at all. This isolates angular pointing, and a longer focal length gives a larger, easier signal. Place the sensor at the focal plane, not at an image of the laser.
Split the beam to two cameras, or to one camera at two distances. The angle is (x₂ − x₁) ÷ L, and the position comes from the first plane. This gives both quantities from the same moments in time, and shows which one dominates.
The lens does not need to be special, but it must be fixed as rigidly as the camera, and the spot must stay well inside the sensor. If the beam is powerful, attenuate before the lens, or sample it with a wedge; a fixed wedge deflects the beam by a constant angle and does not add movement. The beam profiler attenuation guide sizes the optical density, and the Gaussian beam calculator gives the spot size at the focus.
Pointing stability planner
Enter the stability you need to verify and your set-up. The planner shows the spot on the sensor, how many pixels your limit is, the camera’s centroid noise and whether the record is long enough.
Camera, signal and recording details
Model: focused spot (1/e²) = 4 λ f M² ÷ (π D). Limit on the sensor = angle × f (angular) or the position limit itself. Centroid noise, 1σ, in pixels = √((2.2 ÷ SNR)² + b²), with b = 0.01 pixel for spots of 5 pixels or more and 0.025 below that; from our simulation of a background-subtracted, thresholded (5%) centroid on a Gaussian spot with additive camera noise. SNR = peak signal ÷ rms dark noise of one pixel. The result is the camera’s own floor: mounts, air and vibration come on top. Fastest visible jitter = frame rate ÷ 2; the exposure time also averages out faster movement.
How small a movement can a camera see?
The centroid is a weighted average over many pixels, so it moves smoothly when the beam moves by a fraction of a pixel. Its precision is set by the noise in each pixel compared with the peak signal. For a Gaussian spot covering 5 pixels or more, our simulation of a background-subtracted, thresholded centroid gives the following floor:
| Peak signal-to-noise ratio | Centroid noise, 2σ | With 3.45 µm pixels | Angle, f = 500 mm |
|---|---|---|---|
| 50 | 0.090 pixel | 0.31 µm | 0.62 µrad |
| 100 | 0.048 pixel | 0.17 µm | 0.33 µrad |
| 300 | 0.025 pixel | 0.086 µm | 0.17 µrad |
| 1000 | 0.020 pixel | 0.071 µm | 0.14 µrad |
Above a ratio of about 300, a residual of about 0.01 pixel (1σ) from thresholding and pixel sampling dominates. A centroid over a large region of interest without a threshold is several times noisier, because the noise far from the beam is weighted by its distance.
Three practical consequences follow. First, fill the camera well: run the peak at 70–90% of full scale, not at 20%, and never saturate, because clipped pixels pull the centroid. Second, small pixels and a long focal length both help, because they make the same angle a larger number of pixels. Third, the camera floor is rarely the limit in practice; a quick test shows the real one. Replace the laser by a reference beam that is more stable than the laser, for example the output of a single-mode fiber clamped to the same breadboard, and record it with the same settings. That record is the floor of your set-up, and the laser result means something only above it.
Drift, jitter and the frame rate
A record of centroid positions answers different questions depending on how it was taken:
- Jitter is visible up to half the frame rate. A 100 fps camera shows vibration up to 50 Hz; faster movement is averaged within the exposure or folds into lower frequencies. For acoustic or pump-related jitter at hundreds of hertz, use a short exposure and a region of interest to raise the frame rate.
- Pulsed lasers are measured pulse by pulse: trigger the camera from the laser so that each frame holds one pulse, and the record becomes pulse-to-pulse pointing. See pulsed laser beam profiling for the trigger and exposure set-up.
- Drift needs time, not speed. One frame per second for an hour, after the one-hour warm-up, shows thermal drift. A plot of the centroid against time shows a trend that a single standard deviation hides, so report the drift rate as well.
To separate noise from drift, compute the Allan deviation of the centroid: it falls with averaging time while random noise dominates and rises again where drift takes over. The minimum tells you the best averaging time for alignment, and how long a system stays within its limit without correction.
IZAK profiler software reports the centroid in every frame, with time-series monitoring and data export, so these statistics come straight from the logged centroid of the same measurement.
What else moves the centroid
| Cause | What you see | What helps |
|---|---|---|
| Air currents and heat | Random jitter that grows with path length; worse near warm electronics or the laser head | Enclosure or tubes on the beam path, short distances, no fans pointing at the bench |
| Thermal expansion of mounts | Slow drift that follows room temperature. A 100 mm aluminium post grows 2.3 µm per kelvin; at f = 500 mm that reads as 4.6 µrad | Low posts, same material for lens and camera mounts, a stable room, warm-up of the camera too |
| Vibration | Peaks at fixed frequencies (pumps, chillers, fans, building) | Isolated optical table, rigid short mounts, frame rate high enough to see the frequency |
| Signal problems | Sudden steps or noise that changes with power | No saturated pixels, stable background subtraction, the same threshold for the whole record |
| Optics in the path | Drift when a filter or attenuator warms up | Reflective sampling of high power, attenuators sized for the power, and measuring the set-up floor with them in place |
ISO 11670 asks for a bench at least ten times more stable than the laser. In practice, check it the other way round: if the reference-beam record and the laser record look alike, the measurement shows the bench, not the laser.
How to report the result
A pointing-stability figure is only comparable when its conditions are stated. A complete report gives:
- Stability, 2σ, per axisangular in µrad and/or position in µm at a stated plane
- Time scale and recordrecord length, frame rate or pulse rate, number of frames
- Laser statewarm-up time, output power, cold-start change if measured
- Set-upfocal length, distance from the laser, attenuation, set-up floor measured with a reference beam
- Drifttrend of the centroid against time, with peak-to-peak and drift rate
For a laser in production, the same numbers become pass/fail limits: log the centroid for a fixed time after warm-up and compare the 2σ value with the limit, the way beam width and ellipticity are tested. Beam width conventions for those tests are explained in beam width definitions, and divergence, which is measured with the same focal-plane method, in laser beam divergence measurement.
IZAK products for this application
IZAK laser beam profilers are camera-based and report the centroid in every frame. We configure the sensor, the optics in front of it and the software for your laser and your stability limit.
 Beam profiling · 300–1100 nmUV–VIS–NIR Laser Beam ProfilersEight models with pixels from 2.5 to 4.8 µm, for focal-plane pointing measurements and large beams.View product →
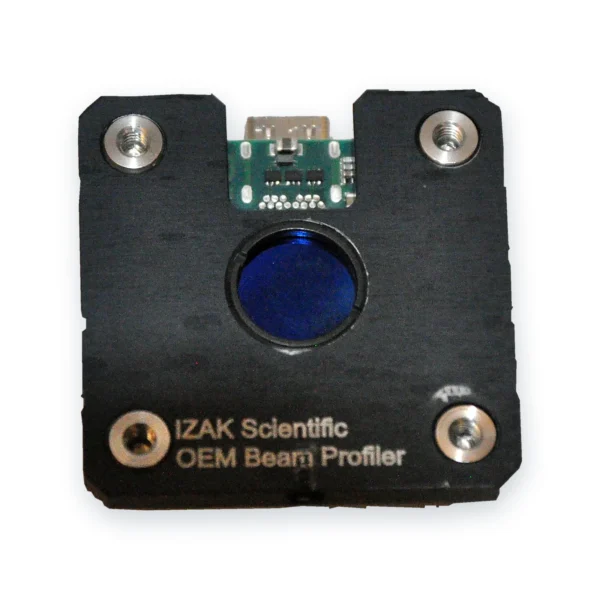 OEM · board levelOEM Board-Level Laser Beam ProfilersCompact global-shutter profilers to monitor pointing inside your system or production station.View product →
 Laser acceptance testingTriBeam PrecisionBeam profile, power or energy and temporal pulse shape in one set-up.View product →
Other wavelengths: SWIR up to 2.05 µm, MWIR 1.5–5.7 µm and LWIR 7.7–12 µm; their pixels are larger, so use a longer focal length for the same angle. Still choosing? Read how to choose a laser beam profiler or the complete guide to laser beam profiling.
What to send us for a recommendation
With these details an engineer can propose the camera, the lens and the attenuation for your stability test:
- Laser type and wavelengthe.g. DPSS, 532 nm
- Beam diameter and divergencewhere the measurement can be placed
- Stability limitµrad and/or µm, 2σ, and over what time
- CW or pulsedrepetition rate, pulse energy, pulse-by-pulse or averaged
- Power or pulse energyfor the attenuation design
- Where it will be usedlab, acceptance test or monitoring inside a system
Frequently asked questions
QWhat is laser pointing stability?
QHow do you measure angular pointing stability with a camera?
QHow small a pointing change can a camera beam profiler detect?
QWhat is the difference between drift and jitter?
QHow long should the laser warm up before a pointing stability test?
QCan pointing stability be measured for pulsed lasers?
References
- ISO 11670: Lasers and laser-related equipment — Test methods for laser beam parameters — Beam positional stability.
- ISO 11146-1: Lasers and laser-related equipment — Test methods for laser beam widths, divergence angles and beam propagation ratios — Part 1: Stigmatic and simple astigmatic beams.
- IEEE Std 1139: Standard definitions of physical quantities for fundamental frequency and time metrology — random instabilities (Allan deviation).
Tzachi Sabati
CEO, IZAK Scientific
Physicist specializing in photonics and quantum technologies, with deep expertise in quantum sensors and advanced optical systems. Leads the Advanced Quantum Lab course at the Technion, bridging academic excellence with industry innovation. At IZAK Scientific, provides cutting-edge photonics-based solutions, developing customized inspection and sensing systems for R&D and production. Passionate about advancing quantum sensing applications and integrating novel technologies to meet industry needs.
