

In short
- Limit what the customer feels. In production, a laser beam profiler usually checks D4σ width on both axes, ellipticity, centroid position against a mechanical datum and, where it matters, pointing or divergence. Use the same width definition as the specification.
- Qualify the measurement before the limits. Repeat the measurement with re-seating and compare its spread with the tolerance. If six standard deviations of the measurement use more than 30% of the tolerance, fix the measurement first.
- Guard-band the acceptance limits. Move each limit inwards by the expanded uncertainty (about 2σ of the measurement). In our example this cuts out-of-spec units shipped from about 590 ppm to about 15 ppm.
- Make every record traceable. Unit serial, station, method settings, values, limits and verdict, every time. Check the station daily with a reference unit.
Which laser beam profiler parameters to limit in production
In R&D a laser beam profiler answers “what does my beam look like?”. On a production line it answers a narrower question: “is this unit inside its specification?”. That needs a short list of parameters, each with a definition, a limit and a known measurement uncertainty. Start from what the customer will notice downstream, not from everything the software can display.
| Parameter | Typical specification | What it catches | Watch out for |
|---|---|---|---|
| Beam width, D4σ, both principal axes | Nominal ± tolerance, e.g. 2.00 ± 0.10 mm | Wrong collimation, lens position, damaged or contaminated optics | Background and analysis area inflate D4σ; state the axis convention |
| Ellipticity (minor / major width) | One-sided, e.g. ≥ 0.87 | Astigmatism, tilted optics, diode fast/slow-axis errors | Low-resolution beams read rounder than they are; keep 10+ pixels across |
| Centroid position | Within a radius of a mechanical datum | Beam not on the housing axis, boresight errors | The fixture, not the laser, often dominates the spread |
| Pointing stability | Centroid motion, µrad rms over a set time | Loose mounts, thermal drift | Needs a time window and a defined statistic |
| Peak or mean level, uniformity | Range, or flatness for top-hat beams | Hot spots, weak modules, shaping-optic errors | Saturation; exposure must be fixed or normalised |
Write the definition into the limit. A 1/e² clip-level width and a D4σ width agree only for a clean Gaussian beam; for beams with wings or side lobes they can differ by tens of percent. If R&D characterised the laser with D4σ, production must test D4σ, with the same analysis area and background method. The differences between definitions are explained in D4σ vs 1/e² vs FWHM: beam width definitions.
Qualify the measurement before you set limits
A pass/fail decision is only as good as the measurement behind it. Before any limit goes into the test software, find out how much the result moves when nothing about the laser changes. A practical study for a beam station:
- Take 10 units that span the normal production range.
- Measure each unit 3 times, removing and re-seating it in the fixture each time, and, if you have them, on each station or with each operator.
- Use the production settings: same exposure rule, background method, analysis area and number of averaged frames.
- Compute the measurement standard deviation σm (repeatability and reproducibility together) and compare it with the tolerance: P/T = 6σm / (USL − LSL).
The usual rule from measurement system analysis practice: below 10% the measurement is capable; 10–30% can be acceptable depending on the cost of a wrong decision; above 30% the measurement is not fit to judge that tolerance. For a ±0.10 mm tolerance on a 2 mm beam, P/T = 30% means σm = 10 µm, which is 0.5% of the width.
The largest contributors on beam stations are almost always the same:
- Background. D4σ is a second moment, so pixels far from the beam carry heavy weight. In our simulation of a Gaussian beam, an uncorrected offset of only 0.1% of the peak inflates the D4σ width by about 12% with an analysis area three times the beam width, and by about 72% with an area five times the width. Subtract a dark frame and use a fixed analysis area of about three beam widths, as ISO 11146 describes.
- Saturation and low signal. Keep the peak between roughly half and nine tenths of full scale, with a fixed rule for exposure. Plan the attenuation so that it does not change between units; see beam profiler attenuation.
- Sampling of the beam. At least 10 pixels across the beam, and the beam under about one third of the sensor width.
- Fixture and warm-up. Kinematic seating for the unit, and a fixed warm-up time before the measurement. A laser that is still drifting thermally adds a spread that no software can remove.
- Frame noise. Averaging N independent frames reduces frame-to-frame noise by √N, but not re-seating or warm-up errors. Average enough frames that frame noise is no longer the largest term, and no more.
Guard bands: turning a tolerance into acceptance limits
If the measured value is compared directly with the specification limits, a unit just outside the limit can measure inside it and ship. That is simple acceptance, and its risk grows with σm. The alternative, standardised in ISO 14253-1 for geometrical product specifications and discussed generally in JCGM 106, is to shrink the acceptance zone by a guard band g on each side:
Accept if LSL + g ≤ measured value ≤ USL − g, with g usually equal to the expanded uncertainty U = 2σm (coverage factor k = 2, about 95% for a normal distribution).
The guard band protects the customer (false accepts) at the cost of the producer (false rejects). How much each costs depends on two numbers: how good the measurement is and how close the process runs to its limits. The calculator below models both, assuming normal distributions for the process and the measurement error.
Pass/fail limit and guard band calculator
Enter the specification, what production really measures, and the repeatability of the station. The calculator separates the true process spread from the measurement spread and shows the acceptance limits, the shipped-defect rate and the share of good units you would reject.
Use any consistent unit (mm, µm, mrad). For two-sided limits only. The model treats the production results as true value plus measurement error, both normally distributed; real processes with skew or drift need more data.
Worked example: a 2 mm collimated module
A laser module has a specified output width of 2.00 ± 0.10 mm (D4σ, both axes). A month of production data gives a mean of 2.02 mm and a standard deviation of 0.030 mm. The observed spread includes the measurement, so the true process spread is √(0.030² − σm²).
First station, σm = 15 µm. P/T = 6 × 0.015 / 0.20 = 45%: not capable. With simple acceptance about 350 ppm of all units are out of specification yet pass. Applying a 2σm guard band (accept 1.93–2.07 mm) cuts that to about 11 ppm, but rejects 4.8% of units that are in fact good. Every one of them is retested, reworked or scrapped.
After fixing the station, σm = 6 µm. Dark-frame subtraction, a fixed analysis area of three beam widths, kinematic seating and a fixed warm-up bring the repeatability down. P/T = 18%. With a 2σm guard band (accept 1.912–2.088 mm) about 14 ppm of out-of-spec units pass, and only 0.86% of good units are rejected. Simple acceptance on the same station would let about 590 ppm through.
| Case | P/T | Acceptance limits | Out of spec but accepted | Good but rejected |
|---|---|---|---|---|
| σm 15 µm, no guard band | 45% | 1.900–2.100 mm | ≈ 350 ppm | 0.32% |
| σm 15 µm, g = 30 µm | 45% | 1.930–2.070 mm | ≈ 10 ppm | 4.8% |
| σm 6 µm, no guard band | 18% | 1.900–2.100 mm | ≈ 590 ppm | 0.12% |
| σm 6 µm, g = 12 µm | 18% | 1.912–2.088 mm | ≈ 14 ppm | 0.86% |
The lesson is in the last column. A guard band always protects the customer; a good measurement is what makes the guard band cheap. Notice also that the observed Cpk is 0.89 in both cases: the process itself needs work, and the beam station is the tool that shows where. A process with Cpk below 1 will keep producing units near the limits, which is exactly where the measurement uncertainty decides the verdict.
100% test or sampling?
A camera beam profiler measures a unit in seconds once the fixture and settings are fixed, so for lasers built in-house, 100% testing is usually the right answer. Sampling makes sense for incoming inspection of purchased laser modules, for destructive or slow tests, and for audits of a stable process.
If you sample, know what the sample can prove. With zero failures in n units, the defect rate is below p at 95% confidence when n ≥ ln(0.05) / ln(1 − p). That is 299 units to show less than 1% defective, 598 for 0.5% and 2995 for 0.1%. A sample of 20 with no failures shows only that the defect rate is probably below about 14%. Attribute sampling plans per ISO 2859-1 give standard sample sizes and acceptance numbers by lot size and AQL; the arithmetic above explains why they are larger than intuition suggests.
Whatever the plan, check the station itself. Measure a reference unit (a stable laser kept for this purpose) at the start of every shift, plot the results on a control chart with limits at ±3σm, and stop testing when a point falls outside. Long-term trends are easier to see with automated monitoring; see AI analytics for laser beam profiling.
What a production test report should contain
A pass/fail verdict without context cannot be audited, compared between stations or used to find the cause of a field failure. Each unit record should hold:
- Identity: unit serial number, batch or work order, date and time, station and operator.
- Measurement system: profiler serial number, software version, last verification against the reference unit.
- Method: wavelength, attenuation configuration, exposure, background method, analysis area, number of averaged frames, width definition.
- Results and limits: for each parameter, the value, the lower and upper acceptance limits and the individual verdict, then the overall verdict.
- Evidence: the beam image or cross-sections, so an engineer can see what a failure looked like.
Store the records in a format that can be analysed later, such as CSV or a database, not only as PDF. The IZAK laser beam profiler software can run as an automated test with pass/fail limits and a report for every unit, so these records are produced without manual copying.
Common production QA mistakes
Limits copied from the datasheet without a measurement studyP/T unknown
If σm is unknown, so is the risk of every verdict. Run the repeat study first, then set limits and guard bands.
Different methods in R&D and productiondefinition mismatch
A 1/e² width in production against a D4σ width in the qualification report produces systematic failures or escapes. Keep one method document for both.
Exposure changed per unit by handhidden variable
Automatic or rule-based exposure with a fixed target level removes an operator-dependent term from σm.
Pulsed lasers on a rolling-shutter cameradistorted profiles
Pulsed sources need a global-shutter profiler with an external trigger; see pulsed laser beam profiling.
Pointing limits without a time windowundefined statistic
State the duration, sample rate and statistic (rms, peak-to-peak). The method is described in laser pointing stability: how to measure drift and jitter.
IZAK products for this application
The IZAK Laser Beam Profiler software measures ISO 11146 second-moment widths, ellipticity, orientation and centroid, and includes pass/fail limits, automated test with a report for each unit, time-series monitoring and an API for integration with your own test software.
 UV to LWIRLaser Beam ProfilersUV–VIS–NIR 300–1100 nm, SWIR up to 2.05 µm, MWIR 1.5–5.7 µm and LWIR 7.7–12 µm, with test and report modes.View product →
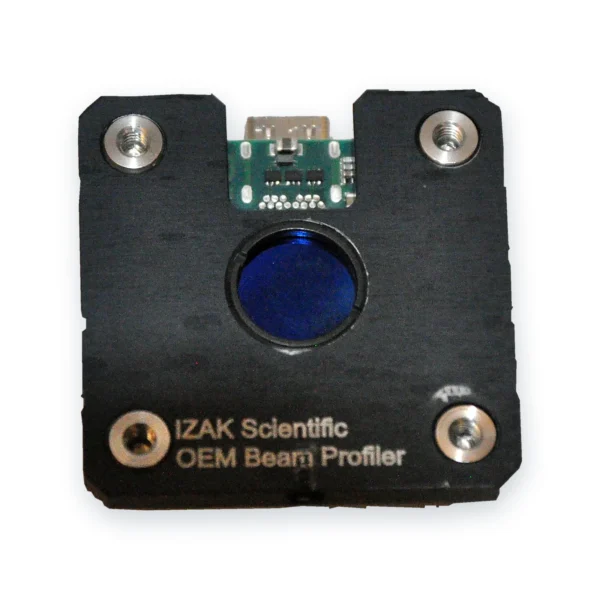 For testers and machinesOEM Board-Level Beam ProfilersUSB 3 powered modules from 7 g, with pass/fail, logging, reporting and an API built in.View product →
Need the whole station, fixture and software? See custom electro-optical test systems or book a beam profiler consultation.
Frequently asked questions
QHow do I set pass/fail limits for a laser beam profiler test?
QWhat is a guard band in production testing?
QHow many units should I sample for incoming inspection of lasers?
References
- ISO 11146-1:2021, Lasers and laser-related equipment — Test methods for laser beam widths, divergence angles and beam propagation ratios — Part 1: Stigmatic and simple astigmatic beams.
- ISO/TR 11146-3, Part 3: Intrinsic and geometrical laser beam classification, propagation and details of test methods.
- ISO 14253-1:2017, Geometrical product specifications (GPS) — Inspection by measurement of workpieces and measuring equipment — Part 1: Decision rules for verifying conformity or nonconformity with specifications.
- JCGM 106:2012, Evaluation of measurement data — The role of measurement uncertainty in conformity assessment.
- ISO 2859-1:1999, Sampling procedures for inspection by attributes — Part 1: Sampling schemes indexed by acceptance quality limit (AQL) for lot-by-lot inspection.
Tzachi Sabati
CEO, IZAK Scientific
Physicist specializing in photonics and quantum technologies, with deep expertise in quantum sensors and advanced optical systems. Leads the Advanced Quantum Lab course at the Technion, bridging academic excellence with industry innovation. At IZAK Scientific, provides cutting-edge photonics-based solutions, developing customized inspection and sensing systems for R&D and production. Passionate about advancing quantum sensing applications and integrating novel technologies to meet industry needs.
Get new IZAK guides and tools by email
One short email a month: new technical articles, free calculators and product updates in laser measurement and electro-optics. No spam, unsubscribe anytime.
