

In short
- A focused spot is small, short and intense. A collimated beam of diameter D focused by a lens of focal length f gives a 1/e² spot of 4 λ f M² ÷ (π D): often 5–50 µm, with a depth of focus of a fraction of a millimetre and an irradiance of MW/cm².
- Count the pixels first. A camera profiler needs at least 10 pixels across the beam for a reliable second-moment width. With 3.45 µm pixels that means a spot of about 35 µm or more.
- Smaller spots need a magnified image. An infinity-corrected objective and a tube lens image the focus onto the sensor. Its numerical aperture must collect the whole cone: NA ≥ sin(2θ), where θ is the cone half-angle.
- Find the waist, do not guess it. Scan through the focus in small steps inside one Rayleigh range and wider steps beyond two, as ISO 11146 describes, and take the minimum of the fitted curve.
Why a focused spot is hard to measure
The focus is where the laser does its work: it cuts, welds, marks, couples into a fiber, writes in a resist or treats tissue. It is also the hardest place in the beam to measure. Three things make it difficult at once.
It is small. For a beam of 1/e² diameter D at a lens of focal length f, the Gaussian beam waist at the focus has the diameter
d₀ = 4 λ f M² ÷ (π D)
A fiber laser at 1070 nm with a 5 mm beam and a 100 mm lens gives about 30 µm. A 532 nm beam of 3 mm behind a 10 mm objective gives about 2.3 µm. A camera-based laser beam profiler samples the beam with pixels of a few micrometres, so the smaller spots fall on only a handful of pixels. Below about 10 pixels across the beam, the second-moment width defined in ISO 11146 depends on where the spot sits on the pixel grid and on the noise far from the beam. The small vs large pixels guide shows this in detail.
It is short. The beam stays near its minimum only within one Rayleigh range of the waist, zR = π w₀² ÷ (M² λ), with w₀ = d₀ ÷ 2. For the 30 µm fiber-laser spot this is about 0.6 mm; for the 2.3 µm spot it is under 10 µm. A sensor placed 1 mm away from the true waist measures a larger beam and reports it as the focus.
It is intense. The peak irradiance of a Gaussian focus is 2P ÷ (π w₀²). Ten watts in a 30 µm spot is about 3 MW/cm². No camera sensor survives that directly, and the optics in front of it see the same power density.
Three ways to measure the focus
Works when the spot covers at least 10 pixels and fits within about a third of the sensor width. Typical for slow focusing: long focal lengths, small input beams, marking and welding heads with spots of 40 µm and more. The beam is sampled and attenuated before the lens.
An objective and a tube lens form an enlarged image of the focal plane on the sensor. A ×10 relay turns a 5 µm spot into a 50 µm image, 14 pixels across with 3.45 µm pixels. The relay moves with the camera through the focus, so the full caustic can be measured.
A sharp edge or a narrow slit moves across the focus while a detector records the transmitted power. ISO 11146-3 describes these alternative methods. They reach sub-micrometre spots and very high NA, but give a one-dimensional profile per scan and assume a simple beam shape.
The choice is mostly geometry: the spot size against the pixel size, and the cone angle against the NA of the available optics. The planner below works it out from the lens and the beam, and also gives the depth of focus and the irradiance you have to bring down. For the choice between camera and scanning instruments in general, see camera vs scanning-slit beam profiler.
Focused spot measurement planner
Enter the beam at the lens, the lens and the camera. The planner gives the spot size, the depth of focus, whether the camera can measure it directly or needs a magnifying relay, and the steps for a through-focus scan.
Camera details and a filter in the converging beam
Model: collimated input beam at the lens, paraxial Gaussian focusing. d₀ = 4 λ f M² ÷ (π D); zR = π w₀² ÷ (M² λ); cone half-angle θ = D ÷ (2f); relay NA ≥ sin(2θ), which passes the beam’s angular spectrum out to twice its 1/e² half-angle. Direct measurement needs d₀ ≥ 10 pixels and d₀ ≤ ⅓ of the sensor width. Relays are checked at ×2, ×5, ×10, ×20, ×50 and ×100 with the typical NA of long-working-distance objectives (0.055, 0.14, 0.28, 0.42, 0.55, 0.7). Peak irradiance = 2P ÷ (π w₀²). Scan planes at 0, ±0.5, ±1, ±2, ±2.5 and ±3 zR. Focus shift of a plane-parallel plate in the converging beam = t (n − 1) ÷ n. Aberrations of the lens are not included; they make the real spot larger.
Building a magnifying relay
The relay is a small microscope without an eyepiece. An infinity-corrected objective looks at the focal plane; between the objective and the tube lens the light is close to collimated; the tube lens forms the image on the sensor. The magnification is the ratio of the focal lengths, m = ftube ÷ fobjective, so a 200 mm tube lens behind a 20 mm objective gives ×10.
Numerical aperture comes first. A laser focus is not like a lit object under a microscope: the relay reproduces it faithfully only if it passes the beam’s whole angular spectrum. The cone leaving the focus has a 1/e² half-angle θ = D ÷ (2f) for a collimated input beam. An objective with NA ≥ sin(2θ) passes everything out to twice that angle, which loses less than 0.1% of the power and leaves the width unchanged. A smaller NA clips the wings of the angular spectrum: the image becomes larger than the real spot and grows rings, and the measured width is too big. Magnification is only the second question: choose the lowest magnification that puts at least 10 pixels across the image, among the objectives that have enough NA.
Calibrate the magnification. The nominal value of an objective and tube lens pair can differ by a few percent from the real one, and the beam width scales with it directly. Two simple checks: image a calibrated stage micrometer under the same relay, or move the focus sideways with a translation stage by a known distance and divide the centroid shift on the sensor by it. The second method uses the laser itself and needs no extra target.
Use the objective as it was designed. Choose an objective corrected for your wavelength, and do not put a cover glass or window between the focus and the objective unless it is designed for one: a plate in a fast cone adds spherical aberration that broadens the image. Coated, infinity-corrected objectives also keep back-reflections from returning to the laser.
When an application needs it, IZAK configures the optics in front of the profiler sensor, including a magnifying relay for small focal spots, and the magnification is then calibrated as part of the set-up.
Finding the waist: the through-focus scan
A single image at the “focus” is only as good as the position where it was taken. The reliable way is to scan through the focus and fit the beam width against position. ISO 11146 asks for at least ten measurement planes, about half of them within one Rayleigh range of the waist and about half beyond two Rayleigh ranges. The planner proposes eleven planes: 0, ±0.5, ±1, ±2, ±2.5 and ±3 zR.
- Move one unit. With a relay, move the objective and the camera together, or move the focusing lens; the plane being measured is always the object plane of the relay.
- Use a fine stage. The step inside the Rayleigh range is half of zR: 0.3 mm for a 30 µm spot, but only a few micrometres for a 2 µm spot. The stage resolution should be ten times finer than that step.
- Fit, then read. Fit the squared width with a parabola in position, d²(z) = a + b z + c z². The minimum of the fit is the waist diameter and its position; the curvature gives the divergence. The same data set gives the beam propagation ratio, as described in the M² measurement guide.
- Keep the camera settings honest. The peak irradiance on the sensor changes by orders of magnitude between the waist and ±3 zR. Adjust exposure or attenuation for each plane so the peak stays at 70–90% of full scale, and subtract the background at every setting.
The Gaussian beam calculator shows the whole envelope of the beam around the focus, and is a quick way to check that the fitted waist and divergence agree with the lens and the input beam.
Power: the focus is the hardest place for a sensor
A camera sensor saturates at a very small fraction of the power density in a laser focus, so the beam must be reduced by many orders of magnitude. Where you reduce it matters as much as how much.
Sample before the lens. A wedge reflects a few percent of the beam from each surface, and a second wedge or absorbing filters reduce it further while the beam is still collimated and wide. The focusing lens then forms the same spot at a low power. The beam profiler attenuation guide sizes the optical density for the power and the sensor.
Avoid filters in the converging beam. A plane-parallel plate of thickness t and index n placed between the lens and the focus moves the focus away by t (n − 1) ÷ n: a 3 mm filter of index 1.5 moves it by 1 mm. In a fast cone the plate also adds spherical aberration. Behind a 100 mm lens with a 5 mm beam the Rayleigh range is about 0.54 mm, so that 1 mm is almost two Rayleigh ranges. With a relay, attenuate in the collimated space between the objective and the tube lens instead, where a filter does not shift the image plane.
Mind the thermal lens. At full power the focusing optics absorb a little of the beam, heat up and form a thermal lens: the focus moves and the spot can grow. A low-power measurement through a sampled beam does not show it. If the process runs at high power, sample after the lens with a reflective pick-off at full power, and compare the waist position with the low-power result.
What goes wrong, and how to see it
| Problem | What you see | What helps |
|---|---|---|
| Too few pixels | The width jumps when the spot moves by a fraction of a pixel; ellipticity changes with position | A magnifying relay or smaller pixels, for at least 10 pixels across the beam |
| NA of the relay too low | Image larger than expected, faint rings around the spot, divergence from the fit too small | An objective with NA ≥ sin(2θ); compare the image with the calculated spot |
| Magnification not calibrated | All widths off by the same few percent | Stage micrometer, or a known lateral move of the focus |
| Not at the waist | The “focus” changes from day to day | A through-focus scan and a fit, every time the set-up changes |
| Saturation | Flat-topped profile, width too large near the waist | Peak at 70–90% of full scale, more attenuation or shorter exposure at the waist |
| Filter or window in the cone | Focus shifted by about t (n − 1) ÷ n, spot broader than calculated | Attenuate in the collimated beam; a window only where the optics are designed for it |
| Background and noise | Second-moment width too large for small spots, unstable results | Background subtraction, a region of interest about three widths across, an aperture or threshold as ISO 11146 describes |
How to report a focused spot
A focal spot number is only comparable when its conditions are stated. A complete report gives:
- Waist diameter and definitionsecond-moment (D4σ) or 1/e², in x and y, from the fit
- Waist positionrelative to a mechanical reference, e.g. the lens flange or the nozzle
- Methoddirect, relay with its magnification and NA, or knife-edge
- Scannumber of planes, range, and the fit residuals
- Beam and powerinput diameter, wavelength, power during the measurement and how it was attenuated
For definitions of the widths, see beam width definitions. For a laser in production, the waist diameter and position become pass/fail limits in the same way as divergence; the method for divergence is in laser beam divergence measurement.
IZAK products for this application
IZAK laser beam profilers are camera-based, with second-moment widths according to ISO 11146. We configure the sensor, the relay optics in front of it and the attenuation for your spot size and power.
 Beam profiling · 300–1100 nmUV–VIS–NIR Laser Beam ProfilersEight models with pixels from 2.5 to 4.8 µm, for direct focal-spot measurements and relay set-ups.View product →
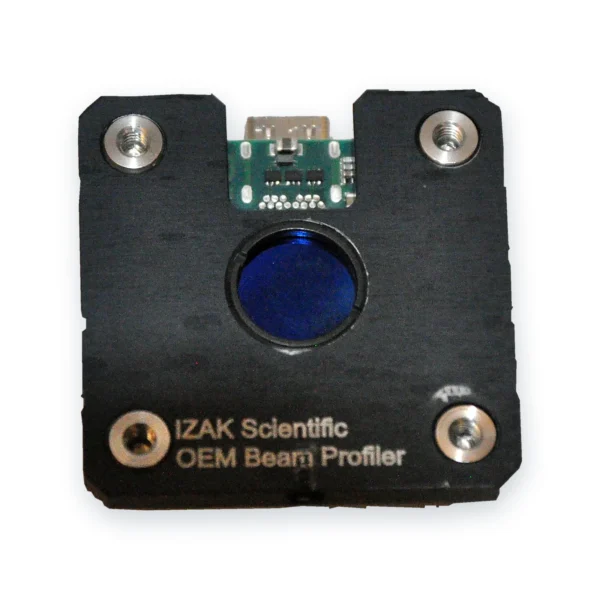 OEM · board levelOEM Board-Level Laser Beam ProfilersCompact global-shutter profilers to check the focus inside a machine or a production station.View product →
 Laser acceptance testingTriBeam PrecisionBeam profile, power or energy and temporal pulse shape in one set-up.View product →
Other wavelengths: SWIR up to 2.05 µm, MWIR 1.5–5.7 µm and LWIR 7.7–12 µm; their pixels are larger, so small infrared spots need a relay sooner. Still choosing? Read how to choose a laser beam profiler or the complete guide to laser beam profiling.
What to send us for a recommendation
With these details an engineer can propose the camera, the relay and the attenuation for your focal spot:
- Laser type and wavelengthe.g. fiber laser, 1070 nm
- Focusing opticsfocal length, beam diameter at the lens, working distance
- Expected spot sizeand the tolerance you need to verify
- CW or pulsedrepetition rate and pulse energy
- Power or pulse energy at the focusfor the sampling and attenuation design
- Where it will be usedlab, acceptance test or inside a machine
Frequently asked questions
QHow do you measure a focused laser spot size?
QHow small a spot can a camera beam profiler measure directly?
QHow do I calculate the focused spot size of a laser?
QWhat numerical aperture does the relay objective need?
QCan I put an ND filter between the lens and the focus?
QHow many positions does a through-focus scan need?
References
- ISO 11146-1: Lasers and laser-related equipment — Test methods for laser beam widths, divergence angles and beam propagation ratios — Part 1: Stigmatic and simple astigmatic beams.
- ISO 11146-3: Lasers and laser-related equipment — Test methods for laser beam widths, divergence angles and beam propagation ratios — Part 3: Intrinsic and geometrical laser beam classification, propagation and details of test methods.
- ISO 13694: Optics and optical instruments — Lasers and laser-related equipment — Test methods for laser beam power (energy) density distribution.
Tzachi Sabati
CEO, IZAK Scientific
Physicist specializing in photonics and quantum technologies, with deep expertise in quantum sensors and advanced optical systems. Leads the Advanced Quantum Lab course at the Technion, bridging academic excellence with industry innovation. At IZAK Scientific, provides cutting-edge photonics-based solutions, developing customized inspection and sensing systems for R&D and production. Passionate about advancing quantum sensing applications and integrating novel technologies to meet industry needs.
